
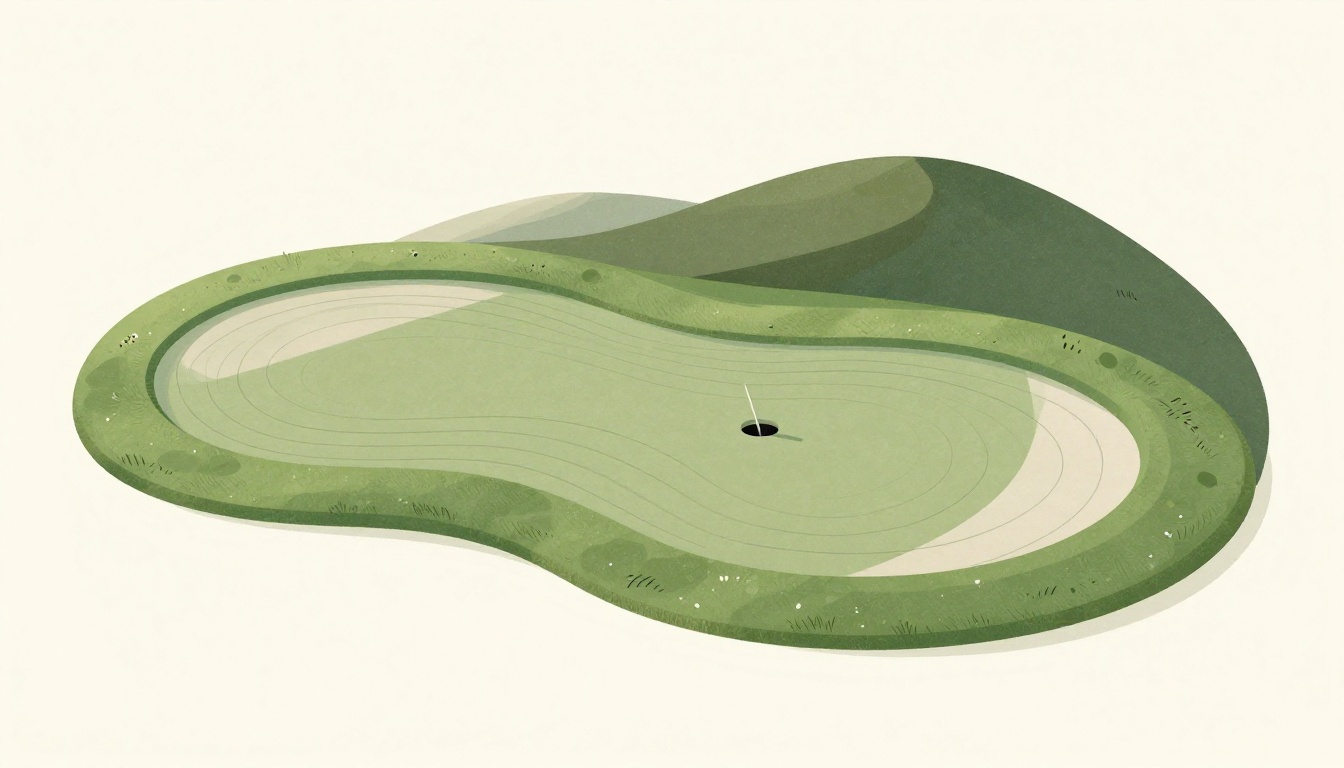
When you're building a golf app, a flat 2D map of a hole only tells half the story. Golfers need to know if the green sits above the fairway, where the slope breaks, and how elevation affects club selection. Without visualizing elevation changes, your users are guessing—and guessing costs strokes. This guide walks you through the data sources and rendering techniques you need to bring terrain to life in your golf course maps.
Which data source is considered the gold standard for golf course elevation work?
Select one answer.
Why elevation matters in golf course mapping
Elevation changes directly affect how a hole plays. An approach to a green sitting well above you plays longer than the GPS number; a downhill approach plays shorter. A common rule of thumb is roughly one extra yard for every yard of elevation gain, though wind, temperature, and altitude all factor in (source: Golf Pad). Elevation also changes how the ball behaves after landing: a shot into an uphill green lands steeper and stops faster, while a downhill approach releases more.
For course designers and superintendents, slope determines drainage direction, putt break, and whether greens meet USGA specifications (typically 1–3% for putting surfaces) (source: Atlas). For developers, this means elevation data isn't just a nice-to-have—it's core to delivering a useful product.
Data sources for elevation
To visualize elevation, you first need accurate terrain data. Here are the primary sources, ranked by accuracy and use case:
- LiDAR: The gold standard for golf course elevation work. A LiDAR survey captures millions of elevation points per acre, producing a Digital Elevation Model (DEM) accurate to a few centimeters. In the US, the USGS 3DEP program provides free LiDAR coverage for much of the country (source: Atlas).
- Drone photogrammetry: Drones with ground control points can achieve 1–5 cm resolution, often better than LiDAR for a specific small area. Tools like Global Mapper Pro's Pixels to Points process overlapping images into point clouds and 3D models (source: Blue Marble Geo).
- On-site GPS survey: RTK GPS or total station surveys provide centimeter-level accuracy for construction verification, but they're time-consuming and costly (source: Atlas).
For most app developers, you won't collect your own data—you'll consume it from an API. Look for providers that offer elevation data as part of their course polygons, or integrate with public LiDAR datasets.
Rendering techniques
Once you have elevation data, here's how to visualize it effectively:
Contour lines
Contour lines are the classic way to show elevation on a 2D map. They connect points of equal elevation, and the spacing between lines indicates slope steepness—closer lines mean steeper terrain. You can generate contours from a DEM using GIS tools like QGIS or Equator, which lets you add contours, LiDAR, or hillshades to your site (source: Equator).
Hillshades
A hillshade simulates sunlight on the terrain, creating a 3D effect on a flat map. It's computed from the DEM by calculating the angle of illumination. Hillshades are great for giving users an immediate sense of the land's form without cluttering the map with lines.
Slope maps
Slope maps color-code the terrain by steepness, often using a gradient from green (flat) to red (steep). This is useful for identifying hazards and landing zones. As noted in the Blue Marble Geo article, you can create a slope map or raster from drone imagery to visualize elevation change (source: Blue Marble Geo).
3D models
For the most immersive experience, render the hole as a 3D mesh. You can extrude the DEM into a textured surface and drape aerial imagery over it. Tools like Global Mapper Pro can generate photo-textured 3D models from drone imagery (source: Blue Marble Geo). In your app, use WebGL or a game engine to let users rotate and zoom around the hole.
Practical steps for your app
- Choose your data source: If you're building for the US market, start with free USGS LiDAR data. For global coverage, consider a commercial API that includes elevation.
- Process the DEM: Use GIS software to clip the DEM to your course boundaries and generate contours, hillshades, or slope rasters.
- Integrate with your map: Overlay these layers on your existing hole polygons. Ensure they align with your coordinate system.
- Add interactivity: Let users tap a point to see its elevation, or toggle between 2D and 3D views. Golf Pad's 3D green maps show slope direction with arrows and steepness with color (source: Golf Pad).
- Test with real courses: Validate your visualization against known elevation changes, like a hole with a 20-foot drop from tee to green.
Quiz: Test your knowledge
Which data source is considered the gold standard for golf course elevation work?
- LiDAR
- Drone photogrammetry
- On-site GPS survey
How the Featured Expert Can Help
Golfbert provides a geodata API for building golf course maps, offering detailed hole information and interactive features for developers. Their API returns detailed hole polygons and vector coordinates, making it easier to render interactive maps with elevation data. Visit Golfbert to explore their documentation and pricing plans for your next golf app project.